

Your Minecraft server is lagging, freezing, or randomly dropping TPS? Don’t panic: in 2026, the most reliable way to understand why it’s happening is Spark. It won’t magically “fix” performance by itself, but it will generate a clear report showing what’s eating your CPU (plugins, entities, chunk generation, redstone, and more).
In this guide, you’ll learn how to install Spark, generate the right report depending on your lag symptoms, and read the key sections to find the real culprit. You’ll also get a copy-paste checklist to contact support with the exact info that speeds up troubleshooting.
Why a Spark report is required
Before any support request related to lag, a Spark report is mandatory. Without it, diagnosing the root cause is mostly guesswork. It’s like asking for a medical diagnosis without describing symptoms or running any tests.
A Spark report shows what’s consuming time on the main thread: an overpowered mob farm, a plugin firing too many events, aggressive chunk generation, or a blocking save task. The big win is simple: you stop “trying random tweaks” and jump straight to actions that actually matter.
🚨 Important: Generate your Spark report while the lag is happening, otherwise it won’t reflect the real problem.
Install Spark on your Minecraft server
Installing Spark is quick whether you run a plugin server (Paper/Spigot) or a modded server (Forge/Fabric). Download the correct build, drop the .jar in the right folder, then restart.
Download Spark from the official Spark download page
Upload the
.jartoplugins/(Bukkit/Spigot/Paper) ormods/(Fabric/Forge)Restart your server
Verify it works with
/spark
📝 Note: If
/sparkdoesn’t respond, double-check the folder and make sure you fully restarted the server.
💬 Good to know: Spark is preinstalled on Paper servers starting from version 1.21.
Generate the right Spark report
There isn’t one “best” Spark command. The right report depends on your symptoms, and the goal is always the same: capture server activity at the exact moment performance drops, for long enough to be representative.
Profile constant lag (low TPS all the time)
If your TPS stays low continuously and everyone feels the lag, run a standard profile for 60 seconds. This gives you a solid picture of the average load.
Server feels slow constantly
TPS stays below 20 (check with
/spark tps)Lag affects all players
Run this command in-game or from the console:
/spark profiler start --timeout 60Wait 1 minute, then copy the report URL shown in chat or console and send it to support.
Profile freezes and lag spikes
If your server is mostly fine but freezes for 1–3 seconds, you want to capture only the slow ticks. This keeps the report focused on the spikes instead of “normal” gameplay.
Regular freezes or rollbacks
TPS is normal, then suddenly drops
Intermittent micro-freezes
Run this command in-game or from the console:
/spark profiler start --only-ticks-over 100 --timeout 180Wait 3 minutes, then copy the report URL shown in chat or console and send it to support.
Profile lag in a specific area
If lag only happens near a base, spawn, farm, or shop area, Spark must profile while the area is loaded. If nobody is there, Spark won’t “see” the entities and tile entities causing the slowdown.
Lag happens only near one build
TPS is fine elsewhere
Problem seems tied to specific chunks
⚠️ Warning: A player must be inside the problem area during the profiling.
Run this command in-game or from the console:
/spark profiler start --timeout 30Wait 30 seconds, then copy the report URL shown in chat or console and send it to support.
Profile lag with many players online
If everything is smooth with 2–5 players but gets worse at 15+ players, generate the report during peak time. This helps capture player-driven load (movement, inventories, anti-cheat, chat, claims, and more).
Performance is good with a few players
Noticeable degradation at 15+ players
Lag scales with activity
⚠️ Warning: Run this command during your player peak.
Run this command in-game or from the console:
/spark profiler start --timeout 30Wait 30 seconds, then copy the report URL shown in chat or console and send it to support.
Checklist before contacting support
Before opening a ticket, make sure your report is actually usable. A good Spark report is captured at the right time, with the right mode, and with a minimum of context.
Report generated during the issue (not on an empty server)
Profiling mode matches your symptoms (constant vs spikes)
Full Spark report link (URL)
Short explanation of what triggers the lag
You can copy-paste this template to save time:
Lag type: [Constant / Spikes / Specific area / Player load]
Spark report: https://spark.lucko.me/xxxxxxx
Players online: XX
Context: [What is happening when the lag starts]
💡 Tip: Add the approximate time and the area coordinates, especially for localized lag.
Common mistakes that ruin diagnosis
These mistakes show up all the time and can make a report nearly useless. Avoid them and you’ll save hours of testing (and a few hairs).
Generating the report on an empty server
Profiling for less than 30 seconds, or too long (over 5 minutes)
Using a “normal” profile for spikes instead of slow-tick mode
Sending the link without any context
Read a Spark report without getting lost
After profiling, Spark gives you a web report link. It contains many sections, but you can usually diagnose the cause with three: platform info, the sampler, and the flame graph.
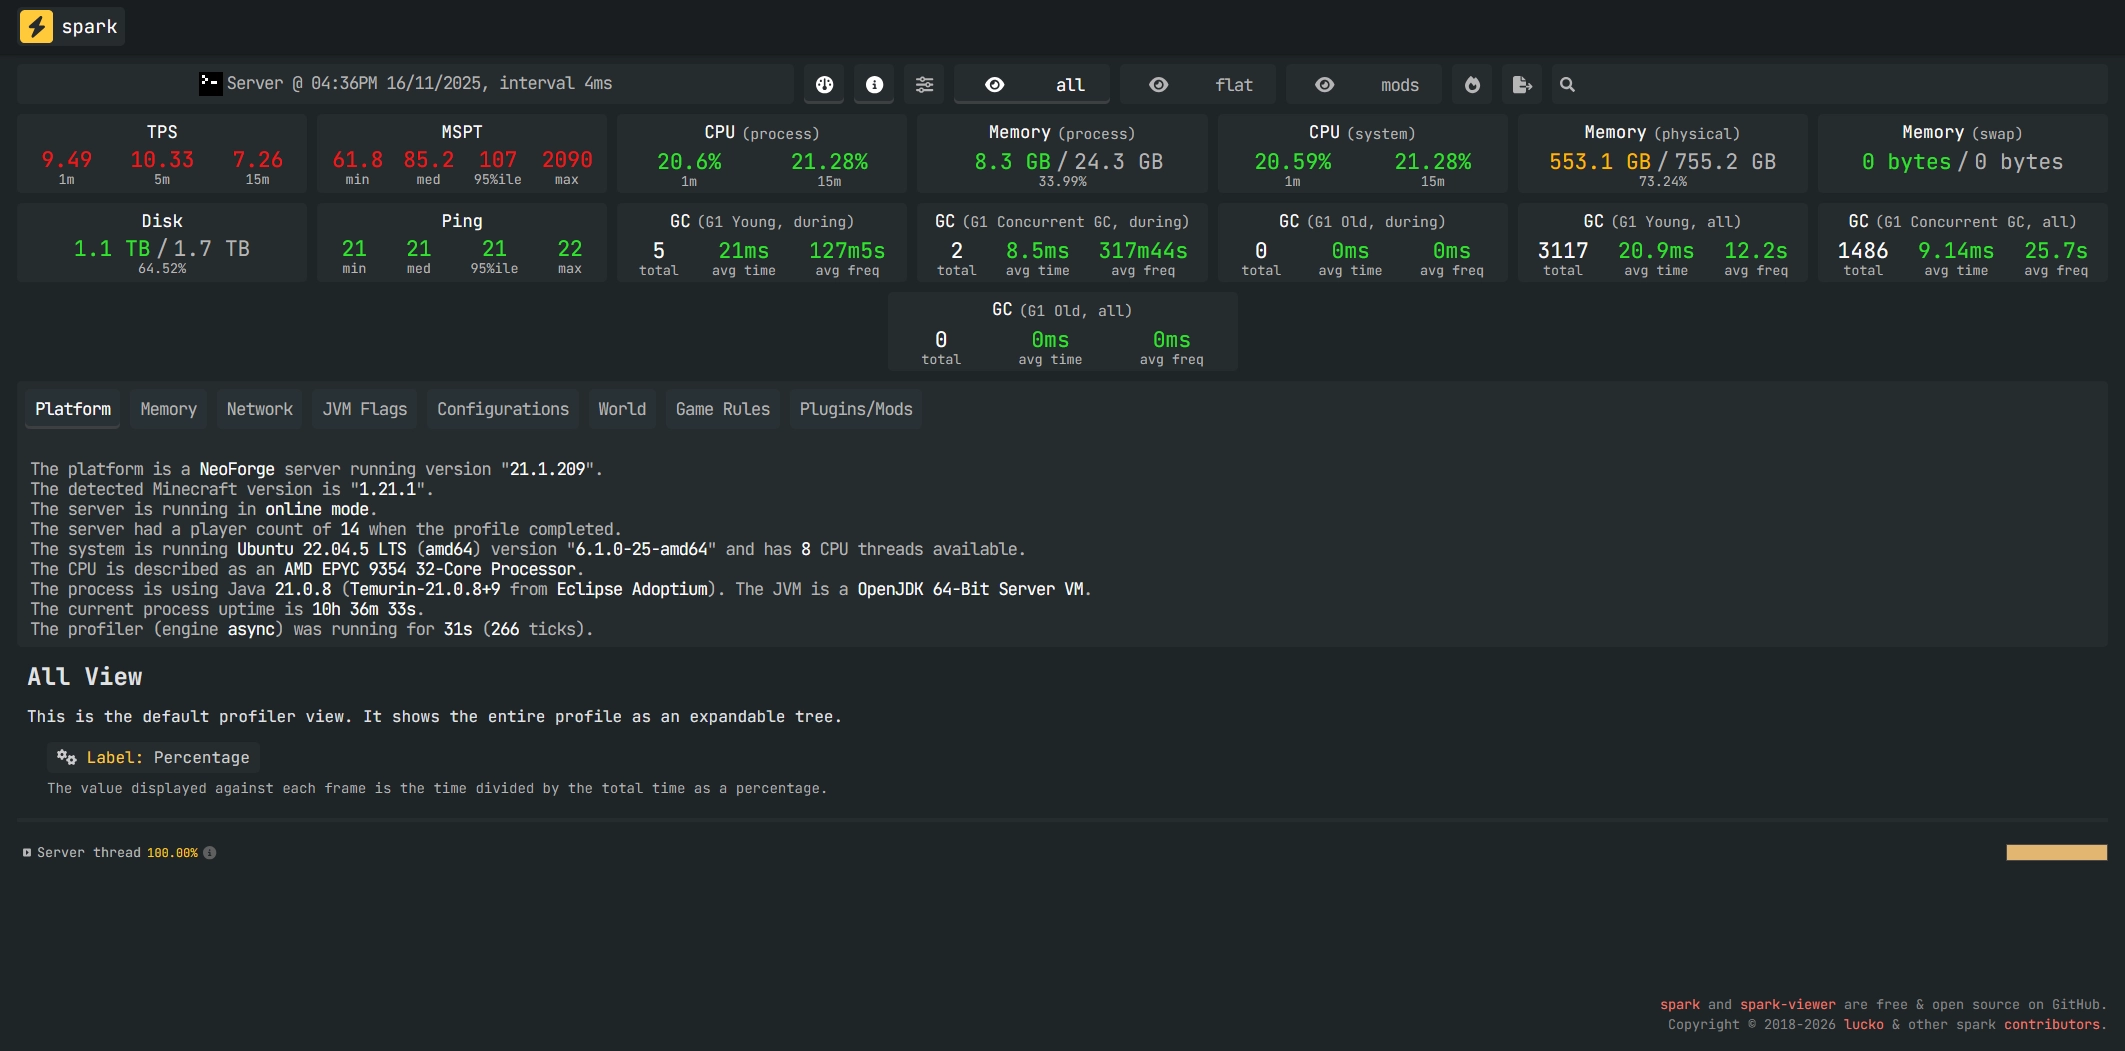
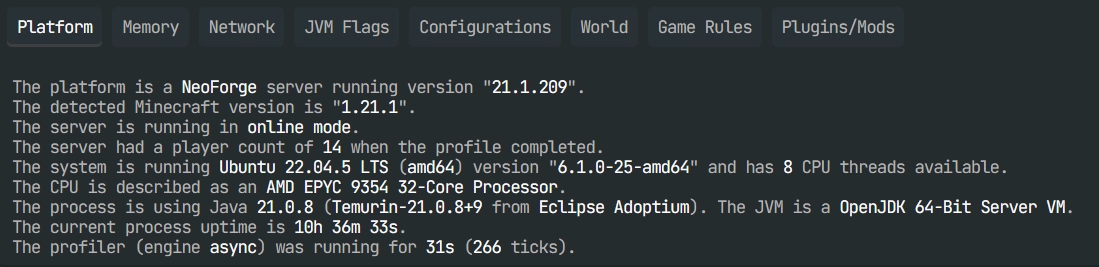
Check Platform Info first
The Platform Info section summarizes your environment: server version, plugin/mod list, JVM flags, and runtime details. It’s perfect for quickly confirming how many players were online, how long the profile ran, how many ticks were captured, and whether anything looks “off” at a glance.
Use Sampler to find the top CPU hogs
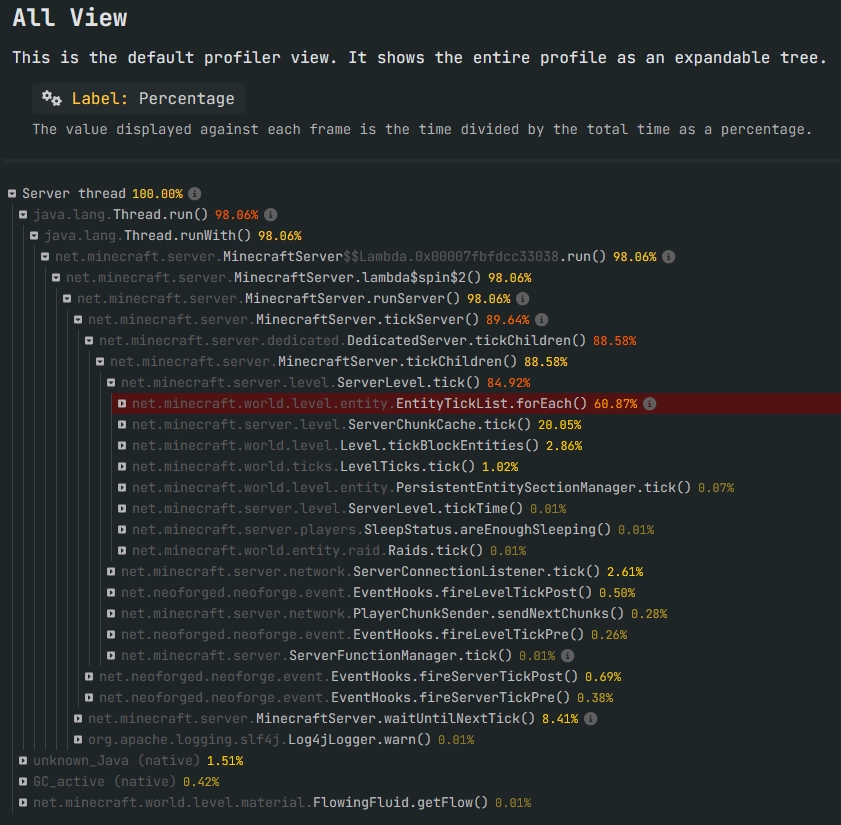
The Sampler ranks methods and tasks by CPU usage, from heaviest to lightest. This is usually your best starting point: if a plugin task sits at the top, you’ve already found a serious suspect.
By default, Spark shows percentages, but reading in Time per tick is often clearer. A healthy server targets 50ms per tick to maintain 20 TPS, so anything pushing total tick time far above 50ms is a red flag.
50%+ on one method: major issue, investigate first
10–30% spread across tasks: often normal, depending on activity
5% or less: usually minor impact
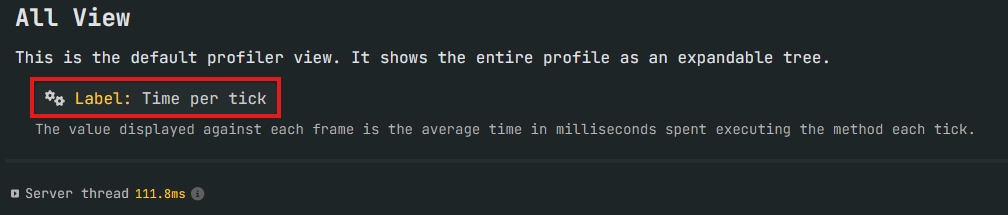
In the example above, total tick time is 111.8ms, which is more than double the baseline 50ms. That’s why TPS drops to around 9.
Spot common lag patterns fast
Some performance profiles show up constantly on Minecraft servers. If you recognize these patterns, you can focus on the changes with the biggest impact instead of tweaking everything blindly.
Fix chunk-related lag
If you see chunk management high in the report (for example ServerChunkCache.tick() above ~30%), the usual cause is fast exploration, massive new chunk generation, or view/simulation distances set too high. Elytra straight-line travel is basically a CPU stress test.
Pre-generate your world with Chunky using this Chunky pre-generation guide
Lower
simulation-distance=6andview-distance=8in server.propertiesReduce extreme exploration bursts
Fix entity-related lag
If entity ticking dominates (for example EntityTickList.forEach() above ~50%), you’re usually dealing with too many mobs, animals, villagers, or farms that keep entities active 24/7. More AI ticking means more CPU heat.
Clean up entities with a ClearLag-style solution
Reduce
entity-activation-rangeinspigot.ymlSet rules for farms and entity counts
Useful Spark commands for daily checks
Beyond the profiler, Spark includes quick commands to check server health. They’re great before running a longer profile, or to confirm a suspicion in 10 seconds.
Use these commands to check TPS and generate a health report:
/spark tps
/spark healthreport
Use this command to analyze memory and spot potential leaks:
/spark heapsummaryThis is especially useful on servers with lots of plugins or mods, where abnormal memory patterns can hint at a misbehaving component.
Questions frequently asked
How long should I run a Spark profile?
For constant lag, aim for 60 seconds. For spikes, run it long enough to capture a few freezes, even though 60 seconds is often enough. Too short can create false leads, and too long can dilute the spike data and make the report harder to read.
Why does my report look “clean” while the server lags?
Most of the time, the report was captured at the wrong moment: empty server, the problem area wasn’t loaded, or no spike happened during the profile. Run Spark again during the lag, and make sure a player is in the affected area if it’s localized.
Does Spark work with plugins and mods?
Yes. Put the .jar in plugins/ for Paper/Spigot, and in mods/ for Forge/Fabric. Report reading is the same, although modded stacks may include mod-specific calls.
Conclusion
Spark is the #1 tool to diagnose Minecraft server lag: it shows what’s consuming CPU, when it happens, and what triggers it. If you generate the right report (constant lag, spikes, specific area, or player load) and focus on the Sampler, you’ll go from “it lags” to a concrete action plan.
Need help interpreting your Spark link? Prepare your report URL and context, then reach out via MineStrator support. And if you don’t have a server yet, you can try it free for 12 hours, no credit card required.

 Enjoy 10% off your first month of server with MineStrator using the code ACTU10!